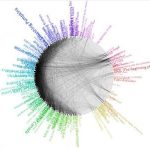
Infographic’s are beautiful ways of representing data in a visual way. Beautiful data helps us to understand things better. Some Infographic’s keep things very simple, with symbols, however they can be taken to the other extreme where they’re so graphic they’re not so easy to grasp on first glance.